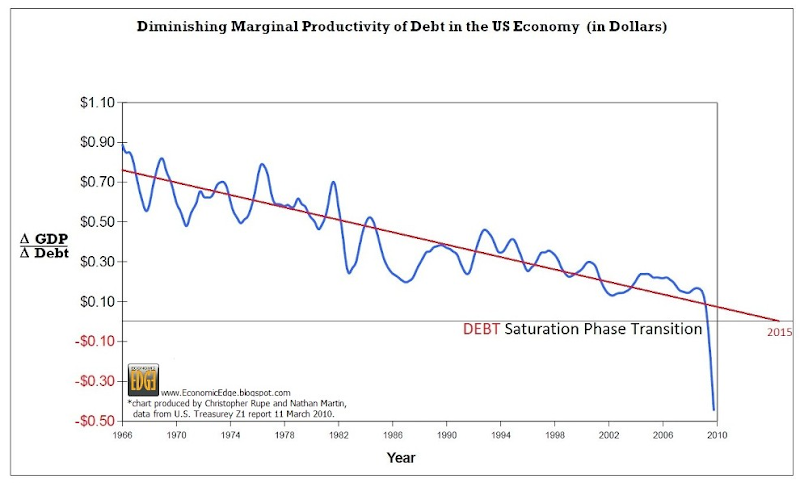
The Most Important Chart of the Century: Diminishing Marginal Productivity of Debt in the US Economy
Replies to This Discussion
-
Permalink Reply by Localtarian on
-
Not too sure that there's an updated chart out there since this one was made. But the margin value the US debt to GDP as of today, really isn't entirely different. I'm sure it's plunged a bit more since this chart was released, seeing as the debt to GDP growth has increased a ton. I also haven't been doing so much chart looking at/searching lately wither, but I do know that today, it takes $10 of GDP growth to pay off $7 of created debt. Hard accomplish a thinning line between the two when you really no longer have any GDP production in your country's economy anymore. It'll be quite interesting to watch China's GDP production here now that they've been crowned the new world super power.
"Destroying the New World Order"
THANK YOU FOR SUPPORTING THE SITE!
Latest Activity
- Top News
- Everything
The Cancel Culture Vulture
Better to shut them down than hear their point of viewCancel culture coming after youHelping to…See More
The Fingerprint
The Fingerprint On a dance with the unpredictability of the signals you sendA solemn pact with my…See More
The Roots of Freemasonry (royales, ancient bloodlines, & end times chronology) w/Gary Wayne
👕 Merch from "The Deep End": https://www.livenotdie.com/thedeep-end🎧 Taylor's DAILY mindset podcast: https://open.spotify.com/show/1SW0ofWSXsmJZDnqKYTpRG?s...
"Bullets can be effective in reinforcing ownership."
Trump Receives Marching Orders
Netanyahu has made 3 visits to the White house since Trump's second term as President of the United…See More
Ben Shapiro Just LOST HIS MIND — There's No Coming Back From This
"Omg. The Ben Shapiro voice that Luke is imitating here couldn't be any more comedic to…"
Ben Shapiro Just LOST HIS MIND — There's No Coming Back From This
Get the magnesium your body needs - https://wearechange.shop/product/magnesium-glycinate/Ben Shapiro Just LOST HIS MIND — There's No Coming Back From ThisHig...
A few reasons I don’t like jews. It’s not complicated.
These are the reasons I became antisemitic. It’s not complicated. Sure, I could go on for days, weeks, months outlining everything, but I don’t need to. This...
"Less Prone, Thanks Buddy! I'd like to volunteer as a historical reconstructionist! "
"Welcome to a revolutionary concept in public communication, the truth."
© 2025 Created by truth.
Powered by
![]()