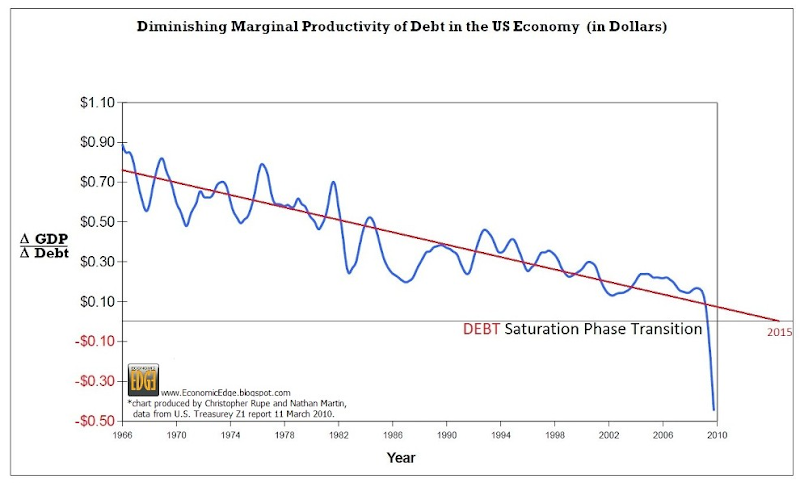
The Most Important Chart of the Century: Diminishing Marginal Productivity of Debt in the US Economy
Replies to This Discussion
-
Permalink Reply by Localtarian on
-
Not too sure that there's an updated chart out there since this one was made. But the margin value the US debt to GDP as of today, really isn't entirely different. I'm sure it's plunged a bit more since this chart was released, seeing as the debt to GDP growth has increased a ton. I also haven't been doing so much chart looking at/searching lately wither, but I do know that today, it takes $10 of GDP growth to pay off $7 of created debt. Hard accomplish a thinning line between the two when you really no longer have any GDP production in your country's economy anymore. It'll be quite interesting to watch China's GDP production here now that they've been crowned the new world super power.
"Destroying the New World Order"
THANK YOU FOR SUPPORTING THE SITE!
Latest Activity
- Top News
- Everything
715995407_27066569266338656_4621890679891427521_n
"cheeki kea I was born in Los Angeles, California and I will never go back there! The Democrats have…"
What was the “Flying Pig” as the Germans Called it?
In 1943 the Eighth Air Force was in a deadly quandary. The US Air Force had no fighter aircraft at…See More
How they Planned the Destruction of America (And Nearly Succeeded)
In 2020 The Democrats went on a major offensive. Prevent Donald Trump from taking office, continue…See More
It's Over. The Tool Bans Just Arrived!
First tool ban is here! A new law was just signed in New York that requires blueprint blocking technology on every CNC machine, laser cutter, lathe and 3D pr...
Angry Old Man James Carville Warns of More to Come?
A new type of signaling is brewing among the left and disenfranchised Democrats who have refused…See More
© 2026 Created by truth.
Powered by
![]()